Kennis
How to read a tidal current atlas and other astronomical data
Gepubliceerd op
1/1/2026
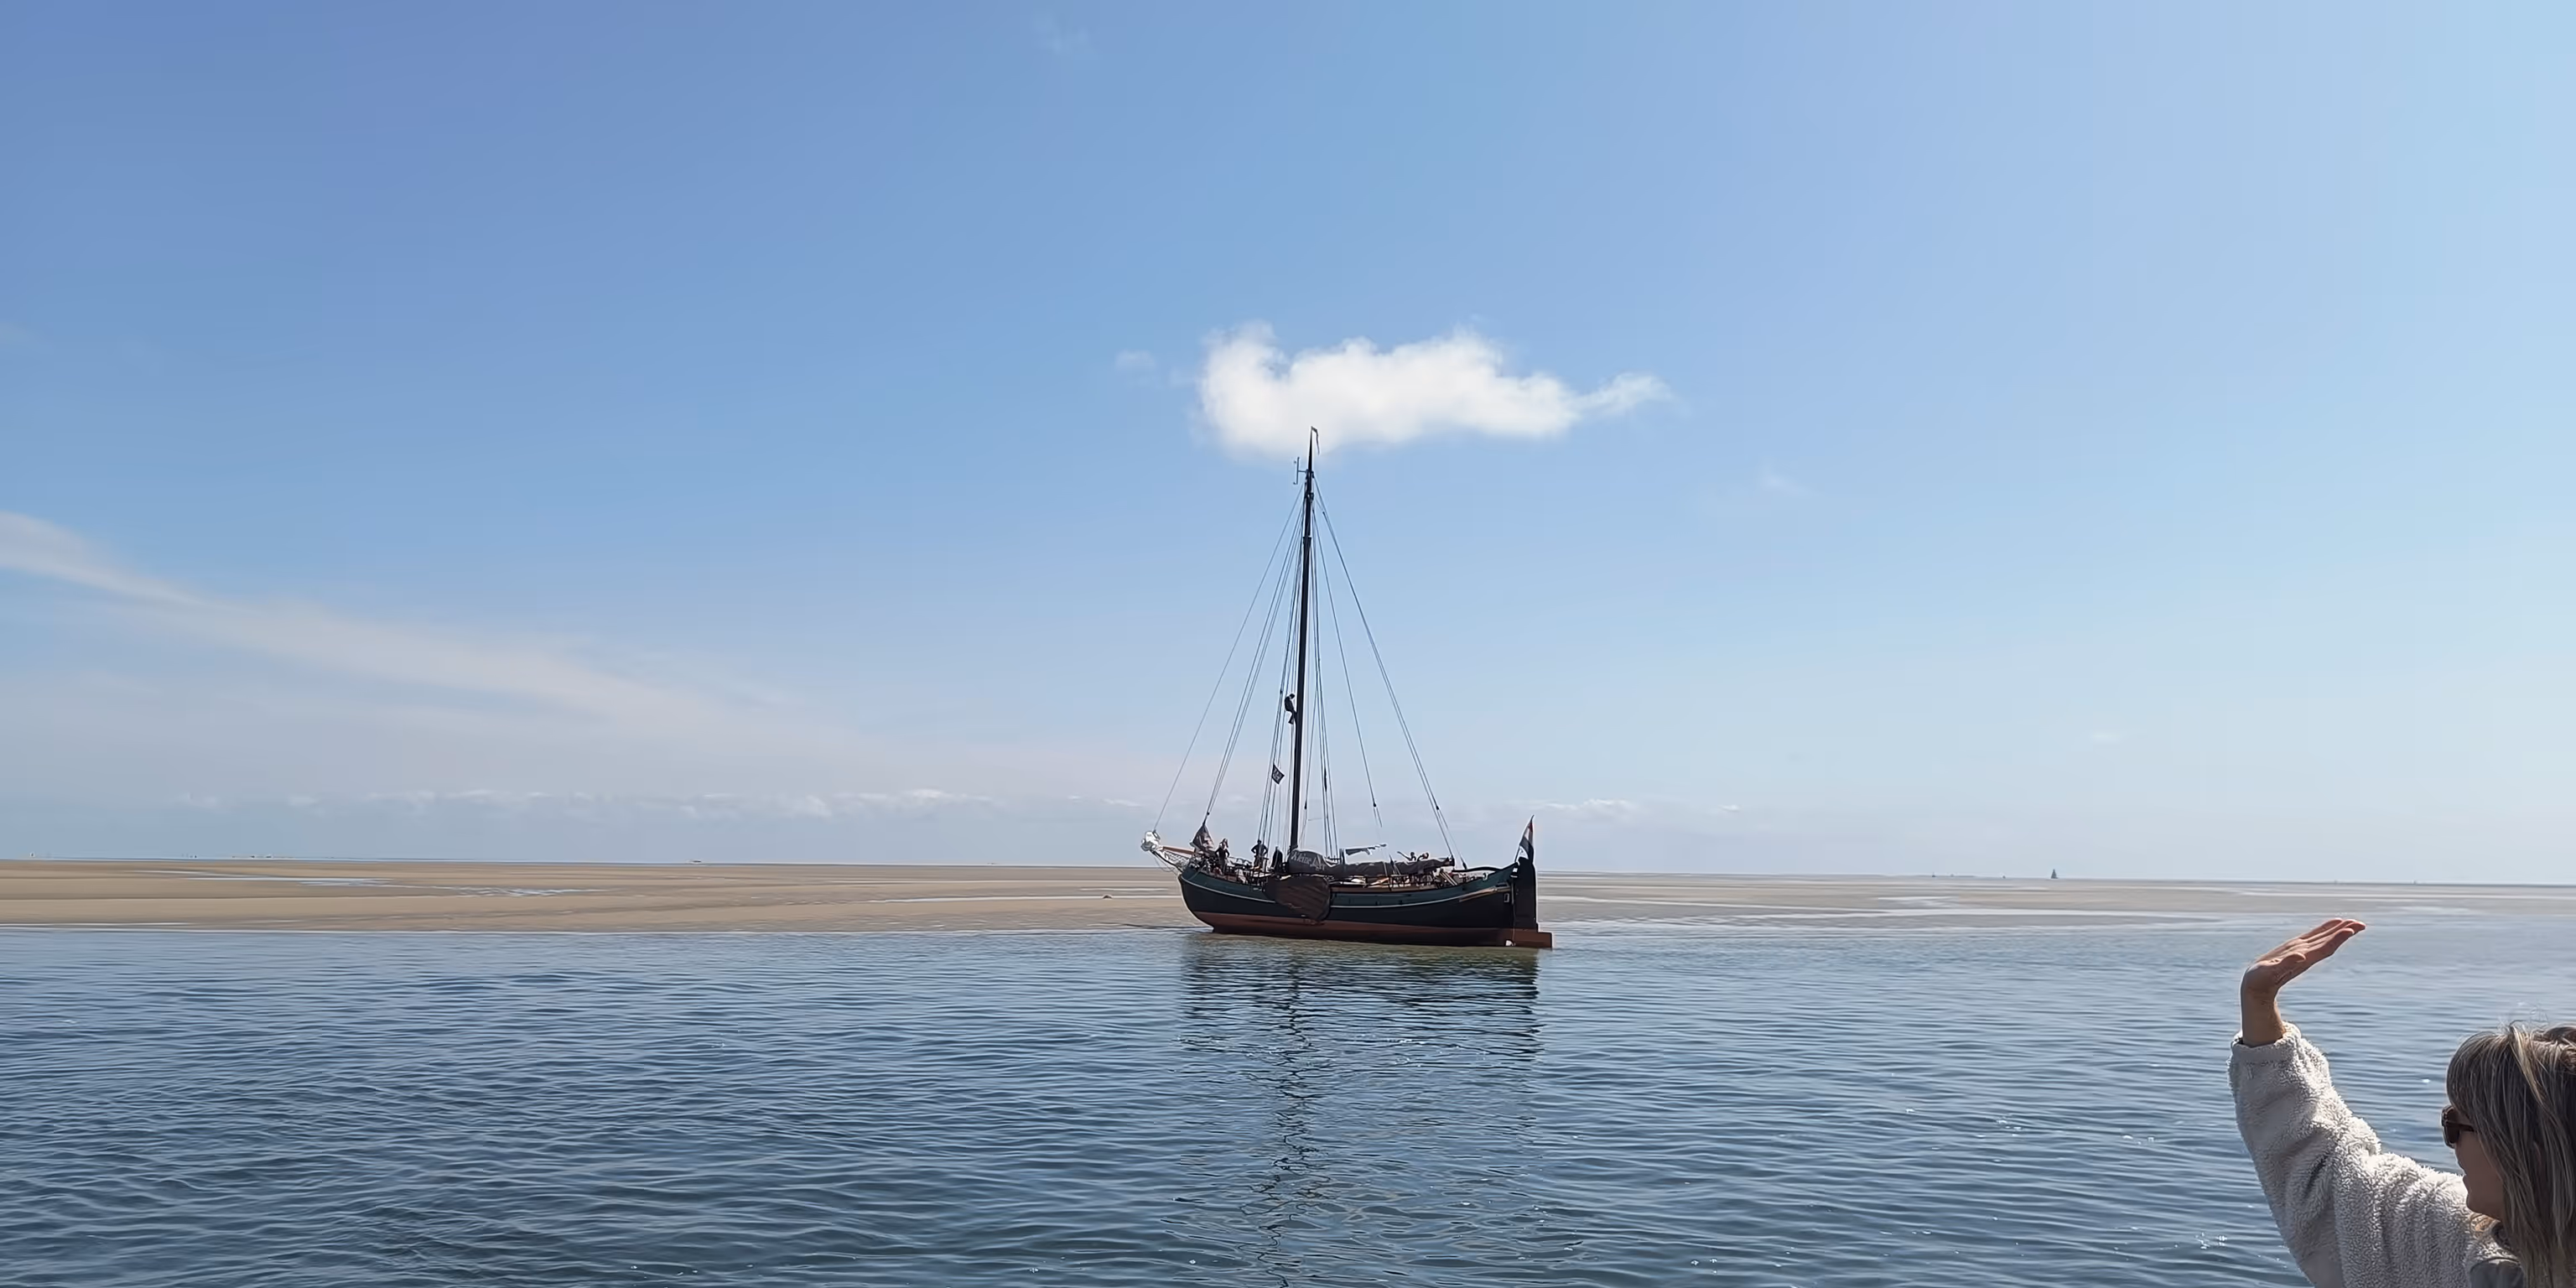
When sailing on tidal waters in the Netherlands, such as the North Sea or the Wadden Sea, in addition to tides, you will also have to deal with currents. How do you read data on currents? And what factors affect the water level?
Diese Informationen sind auch auf Deutsch verfügbar.
Deze informatie is ook beschikbaar in het Nederlands.
In a previous article entitled How do you read a tide table? we talked about tides and how to use the free NLTides program to read tide tables and tide graphs. In this article, we look more closely at how to read a tidal current atlas, and what exactly we mean by chart datum.
Reading tidal current data
In addition to reading tides, you can also use NLTides as a tidal current atlas. When you open the program, you will see many arrows along the coastline. These arrows indicate the direction of the current. You can zoom in to read the speed of the current in knots and see from which direction the current is coming.
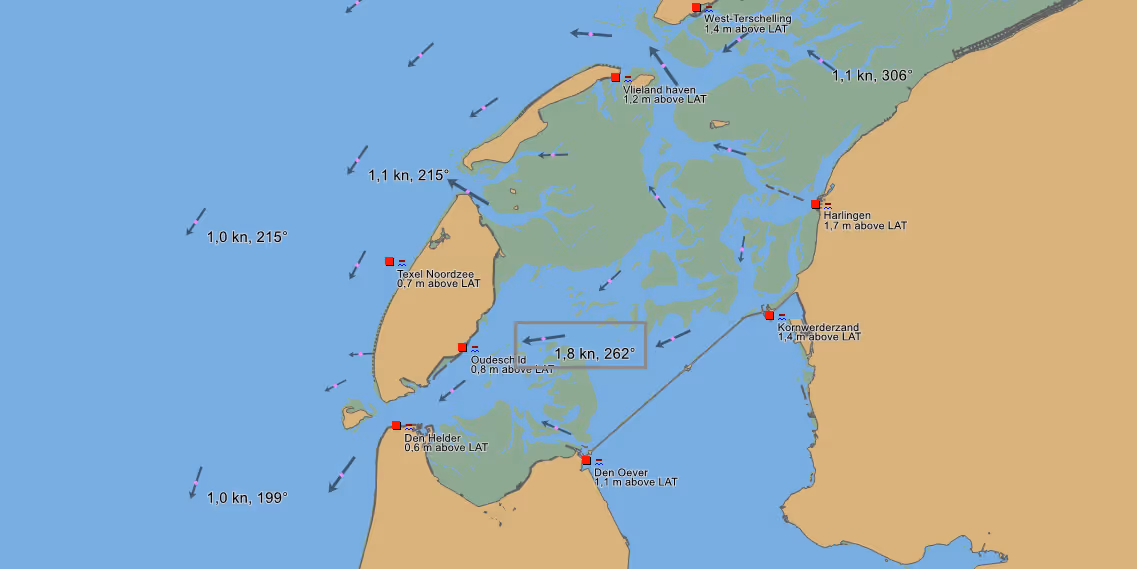
In the above image, the current in this part of the Wadden Sea has a speed of 1.8 knots. This amounts to 3.3 kilometres an hour. The current is roughly westward, with a direction of 262°.
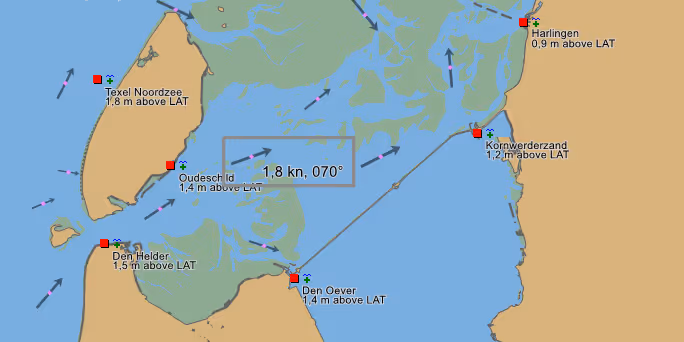
Currents change rapidly. After 6 hours, you can see that, in the same area, the current has turned considerably and is now northeastward, with a direction of 70°.
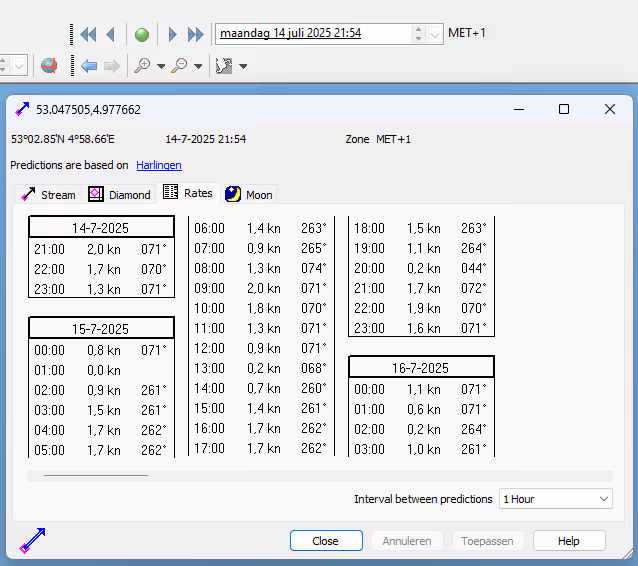
You can click on an arrow to view specific values. A new window will then open. In the ‘Stream’ tab, the direction of the current is shown with a compass. The ‘Diamond’ tab shows the general current direction 6 hours before and after high water (HW). The speed is indicated in knots relative to spring tide and neap tide (Spring Rate and Neap Rate).
You can view the direction and speed of the current for a certain day and time in the ‘Rates’ tab. You can select a day in the current calendar year from the NLTides menu.
The influence of meteorological conditions
Unlike in the case of water levels, the influence of meteorological conditions on current patterns is difficult to determine. This is because weather conditions can have also an effect over large distances. For instance, the weather off the Norwegian coast can affect the current off the Dutch coast.
Differences can thus arise between astronomically predicted and actual measured water levels. These differences are almost always the result of meteorological conditions that can only be predicted shortly in advance. This includes, for example, wind direction or, to a lesser extent, air pressure differences over the North Sea.
Onshore winds generally cause higher water levels and bring forward the times of high water (HW) and low water (LW). Offshore winds have the opposite effect: the times of ebb and flow come later than predicted. Air pressure also affects the water level. The higher the air pressure, the lower the water level.
What is meant by chart datum?
The depths shown on nautical charts and in tidal forecasts are relative to the chart datum. The chart datum is chosen in such a way that it is rarely shallower than the depths indicated on the charts during normal meteorological conditions.
It is important to read this chart information thoroughly and to apply it correctly. Keep in mind: this may vary between countries.
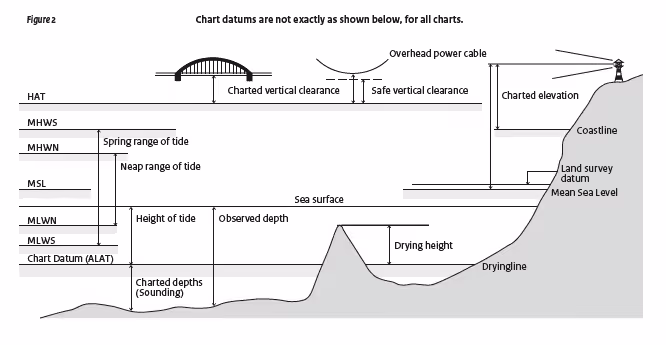
Dutch charts (both digital and on paper) use the Lowest Astronomical Tide (LAT) as chart datum. On rare occasions, the water level will be lower than the LAT datum. About once a year, the water level will be at least 0.50 metres lower than the LAT datum. About twice a month, a water level occurs that is at least 0.25 metres below the LAT datum.
On Dutch inland waterways, the Amsterdam Ordnance Datum (NAP) is used as the elevation reference. The NAP plane along the coast is roughly equal to the average sea level, with a possible variation of plus or minus one decimetre.
Further information
The subjects discussed relating to tides and tidal current atlases fall under the curriculum of the Klein Vaarbewijs II (international equivalent: ICC Inland + Coastal waters). If you would like to learn more about these subjects, we recommend getting the mentioned certificate or take a course in meteorology.
Download NLTides free of charge, the software program provided by the Department of Hydrography (Royal Netherlands Navy).
Blijf op koers!
Sluit je ook aan bij meer dan 10.000 abonnees en ontvang maandelijks de gratis nieuwsbrief met nautische tips en informatie.
The Hydrographic Service of the Royal Netherlands Navy produces nautical charts, accurately defines the Dutch maritime boundaries, performs depth measurements, and publishes weekly Notices to Mariners (NtM). This is how the naval service contributes to safe boating.